Introduction
Crash reporting tools help software teams detect, understand, and fix application crashes before they damage user trust. In simple English, these tools collect crash logs, stack traces, device details, release data, user impact, and error context so developers can find the root cause faster.
For modern teams, crash reporting is not only about “what broke.” It is about knowing who was affected, which release caused it, how serious it is, and what action should come next. This matters more now because users expect stable mobile apps, web apps, SaaS products, games, and enterprise platforms.
Common use cases include:
- Tracking mobile app crashes after a new release
- Finding backend errors affecting customer workflows
- Monitoring crash-free sessions and app stability
- Prioritizing bugs by affected users and revenue impact
- Connecting crash alerts with DevOps, QA, and support teams
Buyers should evaluate SDK coverage, error grouping, alerting, integrations, release tracking, privacy controls, performance impact, pricing, support, and security features.
Best for: Developers, QA teams, DevOps teams, product teams, SaaS companies, mobile app teams, gaming studios, fintech apps, healthcare apps, and enterprises that need reliable application stability monitoring.
Not ideal for: Very small projects with limited traffic, internal tools with low risk, teams that only need basic server logs, or companies already using a full observability platform with strong built-in error tracking.
Key Trends in Crash Reporting Tools
- AI-assisted debugging: More tools are adding AI summaries, suspected root causes, duplicate grouping, and suggested fixes.
- Full-stack context: Crash reporting is moving closer to observability, combining frontend, backend, mobile, logs, traces, sessions, and performance data.
- Mobile-first reliability: Teams now care about crash-free users, app startup time, device conditions, OS versions, and release stability.
- Privacy-aware monitoring: Buyers expect PII controls, data scrubbing, role-based access, audit logs, and secure retention settings.
- Release health dashboards: Modern tools help teams compare versions, detect bad releases, and decide when to roll back.
- Developer workflow integrations: Jira, GitHub, GitLab, Slack, Microsoft Teams, PagerDuty, CI/CD tools, and incident tools are now standard expectations.
- Open-source and self-hosted demand: Some teams prefer self-hosted crash reporting for control, compliance, and cost predictability.
- Usage-based pricing: Pricing is often based on events, sessions, seats, retained errors, or observability volume.
- Session replay plus crash context: Tools increasingly connect crashes with user sessions, breadcrumbs, screenshots, and device behavior.
- Platform expansion: Crash reporting is now common across mobile, web, backend, desktop, game engines, and embedded environments.
How We Selected These Tools
- Selected tools with strong market recognition in crash reporting, error monitoring, or application stability.
- Considered support for modern platforms such as web, mobile, backend, game, and cloud-native applications.
- Checked whether the tool helps teams prioritize issues by user impact, frequency, severity, or release version.
- Considered integration depth with developer, DevOps, QA, and incident management workflows.
- Included a mix of developer-first, mobile-first, enterprise-ready, and observability-focused tools.
- Prioritized tools that support useful crash context such as stack traces, breadcrumbs, device metadata, and release tracking.
- Considered usability for different company sizes, from solo developers to large enterprises.
- Avoided guessing unknown ratings, certifications, or compliance claims.
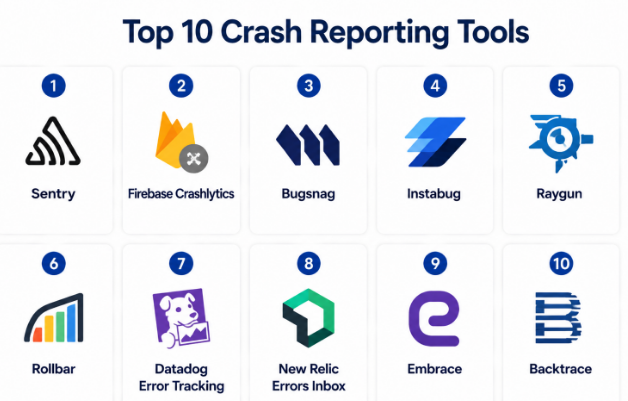
Top 10 Crash Reporting Tools
#1 — Sentry
Short description :
Sentry is a widely used crash reporting and error monitoring platform for developers.
It helps teams detect crashes, track errors, monitor releases, and understand performance issues.
It works well for web, mobile, backend, and full-stack applications.
Sentry is popular among startups, SaaS teams, and engineering-led organizations.
It is especially useful when teams want developer-friendly debugging with strong context.
It can support both small teams and larger enterprises.
Key Features
- Real-time error and crash monitoring
- Stack traces with useful debugging context
- Release tracking and issue regression detection
- Breadcrumbs and event context
- Performance monitoring and tracing capabilities
- Alerting and workflow integrations
- Support for many programming languages and frameworks
Pros
- Strong developer experience and fast setup
- Broad SDK and framework support
- Good balance between crash reporting and application observability
Cons
- Event volume can affect cost planning
- Advanced observability features may require careful setup
- Large teams may need governance around alerts and issue ownership
Platforms / Deployment
Web / Windows / macOS / Linux / iOS / Android
Cloud / Self-hosted / Hybrid
Security & Compliance
SSO/SAML, MFA, RBAC, encryption, audit logs, and compliance details vary by plan. Some details are enterprise-tier dependent. Use “Not publicly stated” for unavailable plan-specific claims.
Integrations & Ecosystem
Sentry has a strong developer ecosystem with integrations across code, alerting, collaboration, and incident workflows.
- GitHub
- GitLab
- Jira
- Slack
- Microsoft Teams
- PagerDuty
Support & Community
Sentry has strong documentation, active developer usage, SDK guides, and community resources. Enterprise support options vary by plan.
#2 — Firebase Crashlytics
Short description :
Firebase Crashlytics is a mobile crash reporting tool from Google’s Firebase platform.
It is designed mainly for mobile app teams building Android, iOS, Flutter, and Unity apps.
It helps developers track crashes, prioritize stability issues, and monitor release health.
It is especially useful for teams already using Firebase or Google mobile development tools.
Crashlytics is simple to adopt for mobile-first engineering teams.
It is best suited for app stability rather than broad full-stack observability.
Key Features
- Real-time crash reporting
- Crash grouping and prioritization
- Crash-free user and session insights
- Android, iOS, Flutter, and Unity support
- Integration with Firebase ecosystem
- Release and version-level crash visibility
- Mobile-focused stability analytics
Pros
- Strong choice for mobile-first teams
- Works naturally with Firebase and Android workflows
- Helpful for tracking app release stability
Cons
- Less suitable for backend-heavy monitoring
- Limited compared with full observability platforms
- Best value often comes when already using Firebase
Platforms / Deployment
iOS / Android / Flutter / Unity
Cloud
Security & Compliance
Security and compliance are tied to Google/Firebase platform controls. Specific plan-level details should be validated by buyers. Not publicly stated for unknown compliance requirements.
Integrations & Ecosystem
Firebase Crashlytics fits strongly inside the Firebase and Google mobile development ecosystem.
- Firebase Analytics
- Google Play workflows
- Android Studio
- BigQuery ecosystem
- Firebase Remote Config
- Google Cloud ecosystem
Support & Community
Documentation is strong, especially for Android and Firebase users. Community support is broad because Firebase is widely used by mobile developers.
#3 — Bugsnag
Short description :
Bugsnag is an error monitoring and crash reporting tool focused on application stability.
It helps teams understand crashes, prioritize errors, and improve software quality.
It is useful for mobile, web, backend, and enterprise software teams.
Bugsnag is known for stability scoring, error grouping, and user impact visibility.
It works well for teams that want structured error ownership and release health tracking.
It is a practical option for companies that need crash reporting with business impact context.
Key Features
- Error and crash monitoring
- Stability score and health tracking
- User impact-based prioritization
- Breadcrumbs and diagnostic data
- Release tracking
- Support for multiple platforms and languages
- Workflow and alert integrations
Pros
- Strong focus on stability management
- Useful prioritization by severity and affected users
- Good fit for product and engineering teams
Cons
- Pricing may need review for high-volume applications
- Some advanced features may depend on plan level
- Teams may need time to configure ownership workflows
Platforms / Deployment
Web / iOS / Android / backend platforms
Cloud / Varies / N/A
Security & Compliance
SSO/SAML, RBAC, audit logs, and compliance details vary by plan. Not publicly stated where exact compliance status is unclear.
Integrations & Ecosystem
Bugsnag integrates with common development and incident workflows.
- Jira
- GitHub
- Slack
- PagerDuty
- CI/CD workflows
- API-based extensions
Support & Community
Bugsnag offers documentation and onboarding resources. Support levels may vary by plan and customer size.
#4 — Instabug
Short description :
Instabug is a mobile-first platform for crash reporting, bug reporting, app performance, and user feedback.It is designed for mobile product teams, QA teams, and app developers.
Instabug helps teams capture crashes along with device details, user steps, screenshots, and feedback.
It is useful when mobile experience quality is a major business priority.
Teams use it to connect technical crashes with real user experience.
It is especially strong for mobile apps that need feedback and diagnostics together.
Key Features
- Mobile crash reporting
- Bug reporting and user feedback
- Session details and device context
- App performance monitoring
- Release health tracking
- In-app feedback capture
- Mobile team collaboration features
Pros
- Strong mobile-focused crash context
- Helpful for QA and product feedback loops
- Good for improving user experience, not just fixing crashes
Cons
- Less suitable for backend-only teams
- May be more than needed for simple crash tracking
- Advanced workflows may require setup effort
Platforms / Deployment
iOS / Android / React Native / Flutter / Varies / N/A
Cloud
Security & Compliance
Security controls vary by plan. Compliance details should be validated directly. Not publicly stated where uncertain.
Integrations & Ecosystem
Instabug connects mobile crash reporting with feedback, project management, and team workflows.
- Jira
- Slack
- GitHub
- Trello
- Zendesk
- APIs and webhooks
Support & Community
Instabug provides product documentation and onboarding materials. Support depth may vary by plan.
#5 — Raygun
Short description :
Raygun is an application monitoring platform with crash reporting, error monitoring, and real user monitoring.It helps teams detect software errors, understand user impact, and improve application quality.Raygun is useful for SaaS products, web applications, and teams that want error and performance insight together.It provides visibility into crashes, affected users, and application performance problems.
It is suitable for engineering teams that need practical diagnostics without building internal tooling.
Raygun can support both small and growing software teams.
Key Features
- Error monitoring and crash reporting
- Real user monitoring
- User impact visibility
- Release tracking
- Error grouping and diagnostics
- Alerting workflows
- Application performance insights
Pros
- Combines crash reporting with user experience monitoring
- Useful for web and SaaS teams
- Helps prioritize by affected users
Cons
- May not be as mobile-specialized as some mobile-first tools
- Pricing should be reviewed for event volume
- Some enterprise controls may depend on plan
Platforms / Deployment
Web / iOS / Android / backend platforms
Cloud
Security & Compliance
SSO, role controls, encryption, and compliance details may vary by plan. Not publicly stated for uncertain claims.
Integrations & Ecosystem
Raygun supports common development and alerting workflows.
- Jira
- GitHub
- Slack
- Microsoft Teams
- PagerDuty
- Webhooks and APIs
Support & Community
Raygun provides documentation and product support. Community strength is moderate compared with larger open developer ecosystems.
#6 — Rollbar
Short description :
Rollbar is an error tracking and crash reporting platform for software teams.
It helps developers detect, triage, and fix production errors across web, backend, and mobile applications.
Rollbar is commonly used by engineering teams that want fast alerts and clear error grouping.
It supports release tracking, deployment context, and workflow integrations.
It is useful for teams that need simple, focused error monitoring.
Rollbar is often a good fit for startups and mid-sized software teams.
Key Features
- Real-time error tracking
- Error grouping and stack traces
- Deployment and release tracking
- Alerting and notifications
- Workflow integrations
- User and environment context
- Support for multiple languages and frameworks
Pros
- Developer-friendly setup
- Strong alerting and triage workflow
- Good for focused error monitoring
Cons
- Broader observability may require other tools
- Cost can depend on event volume
- Advanced enterprise governance may vary by plan
Platforms / Deployment
Web / backend platforms / iOS / Android / Varies / N/A
Cloud
Security & Compliance
SSO, access controls, and compliance details vary by plan. Not publicly stated where exact details are unclear.
Integrations & Ecosystem
Rollbar connects with many common developer workflows.
- GitHub
- GitLab
- Bitbucket
- Jira
- Slack
- PagerDuty
Support & Community
Rollbar has clear documentation and developer guides. Support options vary by subscription level.
#7 — Datadog Error Tracking
Short description :
Datadog Error Tracking is part of the broader Datadog observability platform.
It helps teams detect, group, and investigate errors across applications, services, logs, traces, and infrastructure.It is best for teams already using Datadog for monitoring, APM, logs, or cloud observability.
Datadog is more than a crash reporting tool; it is an enterprise observability suite.
It works well for complex systems where crashes connect to backend services, infrastructure, and traces.
It is especially useful for mid-market and enterprise DevOps teams.
Key Features
- Error tracking across services
- Connection with logs, metrics, traces, and APM
- Service-level context
- Alerting and incident workflows
- Dashboards and monitoring views
- Cloud and infrastructure visibility
- Enterprise observability ecosystem
Pros
- Strong for full-stack monitoring
- Excellent fit for existing Datadog users
- Useful for complex distributed systems
Cons
- Can be more expensive than focused crash tools
- Setup may be more complex for small teams
- Best value comes when using multiple Datadog modules
Platforms / Deployment
Web / backend platforms / cloud infrastructure / mobile support varies
Cloud / Hybrid
Security & Compliance
Enterprise-grade security controls may include SSO, RBAC, audit logs, encryption, and compliance support. Exact compliance details vary by plan and region.
Integrations & Ecosystem
Datadog has a large observability integration ecosystem.
- Cloud providers
- Kubernetes
- CI/CD tools
- Slack
- PagerDuty
- Jira
Support & Community
Datadog provides strong enterprise documentation, onboarding resources, and support tiers. Community and ecosystem strength are high.
#8 — New Relic Errors Inbox
Short description :
New Relic Errors Inbox is part of New Relic’s observability platform.
It helps teams detect, group, and prioritize application errors from monitored services.
It is useful for teams already using New Relic APM, logs, browser monitoring, or infrastructure monitoring.
The tool connects errors with application performance and service health.
It is a strong fit for teams that want crash and error data inside a broader observability workflow.
It is more suitable for engineering organizations than very small one-app teams.
Key Features
- Error grouping and prioritization
- APM and observability context
- Service and transaction visibility
- Alerting workflows
- Dashboards and analytics
- Integration with logs and traces
- Team collaboration around issues
Pros
- Strong for APM-connected error tracking
- Good fit for existing New Relic users
- Useful for service reliability teams
Cons
- May feel heavy for simple crash reporting
- Pricing and data volume need planning
- Setup depends on observability maturity
Platforms / Deployment
Web / backend platforms / cloud applications / Varies / N/A
Cloud / Hybrid
Security & Compliance
SSO, RBAC, audit logs, encryption, and compliance support vary by plan. Not publicly stated where exact status is unclear.
Integrations & Ecosystem
New Relic connects error tracking with observability and incident response workflows.
- Cloud platforms
- Kubernetes
- Slack
- Jira
- PagerDuty
- CI/CD workflows
Support & Community
New Relic has mature documentation, enterprise support options, and a strong observability user base.
#9 — Embrace
Short description :
Embrace is a mobile observability platform focused on mobile app performance, crashes, sessions, and user experience.It helps mobile teams understand crashes in the context of real user sessions.
Embrace is useful for mobile-first companies that need deeper diagnostics than basic crash logs.
It supports teams working on app stability, performance, networking issues, and user impact.
It is especially relevant for consumer apps, fintech apps, media apps, and high-traffic mobile products.
It is best when mobile reliability is a business-critical priority.
Key Features
- Mobile crash reporting
- Session-level diagnostics
- Performance monitoring
- Network and user experience context
- Release health insights
- Mobile observability workflows
- User impact analysis
Pros
- Strong mobile observability depth
- Useful for diagnosing complex mobile issues
- Good for teams focused on app experience quality
Cons
- Less suitable for backend-only monitoring
- May be more advanced than small teams need
- Pricing and setup should be evaluated carefully
Platforms / Deployment
iOS / Android / mobile platforms
Cloud
Security & Compliance
Security and compliance details vary by plan. Not publicly stated where specific details are unclear.
Integrations & Ecosystem
Embrace integrates with mobile engineering and incident workflows.
- Slack
- Jira
- PagerDuty
- Observability tools
- APIs
- Webhooks
Support & Community
Embrace provides mobile-focused documentation and support resources. Community visibility is more specialized than general developer tools.
#10 — Backtrace
Short description :
Backtrace is a crash reporting and error analysis platform often used for complex software, games, desktop apps, and embedded environments.It helps teams collect crash dumps, analyze failures, and debug difficult production issues.Backtrace is useful for companies that need deeper crash diagnostics beyond standard web or mobile stack traces.It is often relevant for gaming studios, device teams, and performance-sensitive software teams.It supports advanced crash analysis workflows for technical engineering teams.It is best when crash dump analysis and detailed debugging matter.
Key Features
- Crash dump collection and analysis
- Error grouping and diagnostics
- Support for native applications
- Debug symbols and stack trace analysis
- Release and version context
- Workflow integrations
- Enterprise-oriented crash investigation
Pros
- Strong for native, game, and complex crash scenarios
- Useful for deep technical debugging
- Good fit for advanced engineering teams
Cons
- May be too technical for simple web apps
- Setup can require deeper engineering knowledge
- Best suited for specialized crash analysis needs
Platforms / Deployment
Windows / macOS / Linux / iOS / Android / game and native environments
Cloud / Self-hosted / Hybrid / Varies by plan
Security & Compliance
Security controls and compliance details vary by deployment and plan. Not publicly stated where exact details are unclear.
Integrations & Ecosystem
Backtrace fits into engineering workflows for crash dump analysis and issue management.
- Jira
- GitHub
- Slack
- CI/CD workflows
- Symbol servers
- APIs and webhooks
Support & Community
Backtrace support is more enterprise and technical-team focused. Documentation is useful for teams comfortable with native debugging workflows.
Comparison Table (Top 10)
| Tool Name | Best For | Platform(s) Supported | Deployment | Standout Feature | Public Rating |
|---|---|---|---|---|---|
| Sentry | Developer-first crash and error monitoring | Web, mobile, backend, desktop support varies | Cloud / Self-hosted / Hybrid | Broad SDK support and release tracking | N/A |
| Firebase Crashlytics | Mobile app crash reporting | iOS, Android, Flutter, Unity | Cloud | Mobile crash-free user and release stability insights | N/A |
| Bugsnag | App stability and user impact monitoring | Web, mobile, backend | Cloud / Varies | Stability score and user impact prioritization | N/A |
| Instabug | Mobile crash reporting with user feedback | iOS, Android, React Native, Flutter | Cloud | Crash reporting plus in-app feedback | N/A |
| Raygun | SaaS and web app error monitoring | Web, mobile, backend | Cloud | Error monitoring with real user impact | N/A |
| Rollbar | Focused developer error tracking | Web, backend, mobile varies | Cloud | Fast alerts and deployment-aware error tracking | N/A |
| Datadog Error Tracking | Enterprise observability users | Web, backend, cloud, mobile varies | Cloud / Hybrid | Errors connected with logs, traces, metrics, and APM | N/A |
| New Relic Errors Inbox | APM-connected error tracking | Web, backend, cloud apps | Cloud / Hybrid | Errors connected with application performance context | N/A |
| Embrace | Mobile observability and app stability | iOS, Android | Cloud | Session-level mobile crash diagnostics | N/A |
| Backtrace | Native apps, games, and crash dump analysis | Windows, macOS, Linux, iOS, Android | Cloud / Self-hosted / Hybrid | Advanced crash dump analysis | N/A |
Evaluation & Crash Reporting Tools
| Tool Name | Core (25%) | Ease (15%) | Integrations (15%) | Security (10%) | Performance (10%) | Support (10%) | Value (15%) | Weighted Total (0–10) |
|---|---|---|---|---|---|---|---|---|
| Sentry | 9 | 9 | 9 | 8 | 8 | 8 | 9 | 8.65 |
| Firebase Crashlytics | 8 | 9 | 8 | 8 | 8 | 8 | 9 | 8.30 |
| Bugsnag | 8 | 8 | 8 | 8 | 8 | 8 | 8 | 8.00 |
| Instabug | 8 | 8 | 8 | 7 | 8 | 8 | 8 | 7.95 |
| Raygun | 8 | 8 | 8 | 7 | 8 | 7 | 8 | 7.80 |
| Rollbar | 8 | 8 | 8 | 7 | 7 | 7 | 8 | 7.65 |
| Datadog Error Tracking | 9 | 7 | 10 | 9 | 9 | 9 | 7 | 8.55 |
| New Relic Errors Inbox | 8 | 7 | 9 | 9 | 9 | 9 | 7 | 8.15 |
| Embrace | 8 | 8 | 7 | 7 | 9 | 8 | 7 | 7.75 |
| Backtrace | 8 | 6 | 7 | 8 | 9 | 8 | 7 | 7.55 |
These scores are comparative, not absolute. A higher score does not always mean the tool is the best choice for every team. For example, Firebase Crashlytics may be better than Datadog for a mobile-only startup, while Datadog may be stronger for an enterprise with distributed systems. Always validate platform fit, integration needs, security requirements, and pricing before final selection.
Which Crash Reporting Tools
Solo / Freelancer
Solo developers usually need something simple, affordable, and fast to install. Sentry, Firebase Crashlytics, and Rollbar are practical options. For mobile-only apps, Firebase Crashlytics is especially useful. For web and backend projects, Sentry or Rollbar can be easier to manage.
SMB
Small and mid-sized businesses should look for easy onboarding, useful alerts, and good integrations with GitHub, Jira, Slack, and CI/CD tools. Sentry, Bugsnag, Raygun, and Rollbar are strong choices. Mobile-first SMBs can also consider Instabug or Embrace.
Mid-Market
Mid-market teams need stronger workflow control, release tracking, ownership, and prioritization. Bugsnag, Sentry, Raygun, Datadog, and New Relic can work well. The best choice depends on whether the team needs focused crash reporting or broader observability.
Enterprise
Enterprises usually need SSO, RBAC, audit logs, compliance support, data governance, and scalable integrations. Datadog, New Relic, Sentry Enterprise, Bugsnag, and Backtrace are strong candidates. Enterprises with native apps, games, or embedded systems should evaluate Backtrace carefully.
Budget vs Premium
For budget-conscious teams, Firebase Crashlytics and Sentry can be practical starting points. Premium options like Datadog, New Relic, Embrace, and enterprise-grade plans provide deeper observability, governance, and support, but they require stronger cost planning.
Feature Depth vs Ease of Use
Firebase Crashlytics and Rollbar are easier for focused use cases. Sentry gives a strong balance of usability and depth. Datadog and New Relic offer deeper observability but may feel complex for smaller teams.
Integrations & Scalability-
If integration depth matters, Sentry, Datadog, New Relic, Bugsnag, and Rollbar are strong options. Teams should check integrations with issue trackers, CI/CD tools, alerting platforms, incident tools, and data pipelines before buying.
Security & Compliance Needs
Security-focused buyers should validate SSO, SAML, MFA, RBAC, encryption, audit logs, data retention, region controls, and compliance documentation. Enterprise teams should avoid choosing a tool only by features; they should also review governance and legal requirements.
Frequently Asked Questions (FAQs)
1. What is a crash reporting tool?
A crash reporting tool collects technical details when an app or software system fails. It usually captures stack traces, device data, operating system details, affected users, and release version information so developers can fix problems faster.
2. How is crash reporting different from error monitoring?
Crash reporting focuses on application crashes and fatal failures. Error monitoring is broader and may include handled exceptions, backend errors, frontend issues, warnings, and non-fatal failures.
3. Are crash reporting tools only for mobile apps?
No. Many tools support web, backend, desktop, cloud, native, and game applications. However, some tools like Firebase Crashlytics and Embrace are especially strong for mobile app stability.
4. What pricing model do crash reporting tools usually use?
Pricing often depends on events, sessions, monthly active users, seats, projects, data retention, or observability volume. Buyers should estimate expected crash and error volume before choosing a plan.
5. How long does implementation usually take?
Basic setup can be quick if SDKs are available for your platform. Full implementation may take longer when adding release tracking, source maps, symbol files, alerts, integrations, privacy rules, and team workflows.
6. What are common mistakes when using crash reporting tools?
Common mistakes include ignoring non-fatal errors, not uploading source maps or symbols, creating too many alerts, failing to assign ownership, and not reviewing crash trends after each release.
7. Are crash reporting tools secure?
Many tools offer security controls such as encryption, access controls, SSO, and data scrubbing. However, buyers should validate compliance, retention, data residency, and privacy controls before sending production data.
8. Can crash reporting tools scale for large apps?
Yes, many tools support high-volume applications, but scalability depends on pricing, event limits, retention rules, sampling, and alerting configuration. Large teams should test expected volume before rollout.
9. What integrations are most important?
The most important integrations are usually Jira, GitHub, GitLab, Slack, Microsoft Teams, PagerDuty, CI/CD tools, and observability platforms. These integrations help teams move from detection to resolution faster.
10. When should a company switch crash reporting tools?
A company should consider switching when the current tool lacks platform support, creates alert noise, becomes too costly, misses critical context, lacks security controls, or does not integrate with engineering workflows.
Conclusion
Crash reporting tools are now a core part of modern software quality. They help teams move faster, reduce user frustration, and make better release decisions. The best tool depends on your product type, team size, platform mix, security needs, and engineering workflow. A mobile-first team may prefer Firebase Crashlytics, Instabug, or Embrace. A full-stack developer team may prefer Sentry, Bugsnag, Raygun, or Rollbar. A large enterprise may get more value from Datadog, New Relic, or Backtrace depending on its observability and crash analysis needs.