Introduction
Mobile performance monitoring tools help teams track how mobile apps behave in real user conditions. In simple English, these tools show whether an app is slow, crashing, freezing, draining battery, loading screens poorly, or failing during important user actions.
Mobile users now expect apps to be fast, stable, secure, and smooth across many devices, networks, operating systems, and locations. A small delay, crash, or screen freeze can reduce trust, increase uninstall rates, and hurt revenue.
Common use cases include:
- Monitoring app startup time and screen load speed
- Finding slow API calls affecting mobile users
- Tracking crashes, freezes, and ANRs
- Understanding poor user experience by device, OS, or network
- Measuring release quality after app updates
Buyers should evaluate SDK quality, crash monitoring, real user monitoring, session diagnostics, network monitoring, app performance impact, privacy controls, integrations, pricing model, alerting, and support.
Best for: Mobile app developers, QA teams, DevOps teams, product managers, SaaS companies, fintech apps, healthcare apps, e-commerce apps, gaming teams, and enterprises with user-facing mobile applications.
Not ideal for: Very small apps with low traffic, simple internal apps, teams that only need basic analytics, or companies already using a full observability platform with strong mobile monitoring included.
Key Trends in Mobile Performance Monitoring Tools
- AI-assisted issue detection: Tools are improving automated root-cause suggestions, anomaly detection, and issue grouping.
- Mobile observability growth: Teams now want crashes, performance, network calls, sessions, traces, and user journeys in one place.
- Release health tracking: More teams monitor performance after every app update to detect bad releases quickly.
- User experience focus: Performance tools now connect technical metrics with real user frustration, drop-offs, and conversion impact.
- Privacy-first monitoring: Data masking, PII filtering, consent handling, and secure data retention are becoming standard buyer requirements.
- Network performance monitoring: Mobile teams are tracking slow API calls, failed requests, weak networks, and backend latency.
- Session replay and diagnostics: Many tools now connect performance issues with real user sessions, screen flows, and breadcrumbs.
- Cross-platform SDK support: Teams expect support for iOS, Android, Flutter, React Native, Unity, and hybrid apps.
- Observability integrations: Mobile performance data is increasingly connected with logs, traces, incidents, CI/CD, and backend monitoring.
- Cost control: Buyers are reviewing event limits, session volume, retention, and sampling to avoid surprise costs.
How We Selected These Tools
- Chose tools widely recognized for mobile performance monitoring, mobile observability, crash reporting, or real user monitoring.
- Considered platform coverage across iOS, Android, Flutter, React Native, Unity, and backend-connected workflows.
- Reviewed whether each tool helps teams detect slow screens, crashes, network issues, app freezes, and release problems.
- Included both mobile-first tools and enterprise observability platforms.
- Considered developer usability, SDK maturity, integration depth, and support ecosystem.
- Balanced choices for startups, SMBs, mid-market teams, and enterprises.
- Avoided guessing public ratings, certifications, or compliance details.
- Prioritized tools that help teams move from issue detection to practical resolution.
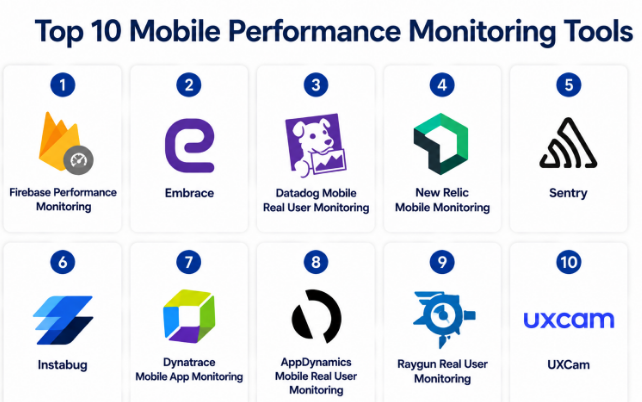
Top 10 Mobile Performance Monitoring Tools
#1 — Firebase Performance Monitoring
Short description :
Firebase Performance Monitoring is a mobile performance monitoring tool from the Firebase ecosystem.
It helps teams track app startup time, screen rendering, network requests, and performance traces.
It is especially useful for Android, iOS, Flutter, and app teams already using Firebase.
The tool is simple to adopt and fits well into mobile development workflows.
It helps developers understand where users face slow app experiences.
It is a strong option for mobile-first teams that need practical performance visibility.
Key Features
- App startup performance monitoring
- Network request tracking
- Custom traces for app workflows
- Screen rendering performance insights
- Firebase ecosystem integration
- Android, iOS, and Flutter support
- Performance dashboard for release analysis
Pros
- Easy choice for teams already using Firebase
- Good mobile-first performance visibility
- Helpful for basic and growing app teams
Cons
- Less suitable for broad enterprise observability
- Limited compared with advanced APM tools
- Best value comes inside the Firebase ecosystem
Platforms / Deployment
iOS / Android / Flutter
Cloud
Security & Compliance
Security and compliance are tied to the broader Google and Firebase platform. Specific compliance details should be validated by the buyer. Not publicly stated where uncertain.
Integrations & Ecosystem
Firebase Performance Monitoring works well with the Firebase and Google app development ecosystem.
- Firebase Crashlytics
- Firebase Analytics
- Firebase Remote Config
- Google Cloud ecosystem
- Android Studio workflows
- BigQuery ecosystem
Support & Community
Firebase has strong documentation and a large developer community. Support options may vary depending on the plan and Google Cloud/Firebase usage.
#2 — Embrace
Short description :
Embrace is a mobile observability platform built for mobile app performance and reliability.
It helps teams understand crashes, freezes, slow sessions, network issues, and user experience problems.
The tool is designed for mobile-first companies that need deep app diagnostics.
It is useful for consumer apps, fintech apps, media apps, healthcare apps, and high-traffic mobile products.Embrace connects technical issues with real user sessions.It is best for teams that treat mobile experience as a serious business priority.
Key Features
- Mobile session diagnostics
- Crash and error monitoring
- App freeze and ANR visibility
- Network performance insights
- Release health monitoring
- User journey context
- Mobile observability dashboards
Pros
- Strong mobile-first observability depth
- Useful for diagnosing complex real-user issues
- Good for product and engineering teams together
Cons
- May be more advanced than very small teams need
- Backend monitoring may require additional tools
- Pricing and setup should be reviewed carefully
Platforms / Deployment
iOS / Android / mobile platforms
Cloud
Security & Compliance
Security controls vary by plan. Compliance details should be validated directly. Not publicly stated where unclear.
Integrations & Ecosystem
Embrace connects mobile monitoring with engineering and incident workflows.
- Slack
- Jira
- PagerDuty
- Observability tools
- APIs
- Webhooks
Support & Community
Embrace provides mobile-focused documentation and support resources. Community strength is specialized around mobile engineering and observability teams.
#3 — Datadog Mobile Real User Monitoring
Short description :
Datadog Mobile RUM helps teams monitor real user experience inside mobile applications.
It connects mobile app performance with backend services, logs, traces, errors, and infrastructure.
It is best for teams already using Datadog or companies that need full-stack observability.
The tool helps engineering teams understand slow screens, network calls, crashes, and user sessions.
It is useful for complex systems where mobile issues may start from backend services.
It is especially strong for mid-market and enterprise teams.
Key Features
- Mobile real user monitoring
- Session, view, and action tracking
- Network request visibility
- Error and crash context
- Backend trace correlation
- Dashboards and alerting
- Full-stack observability integrations
Pros
- Strong full-stack monitoring connection
- Excellent fit for existing Datadog users
- Useful for complex distributed systems
Cons
- Can be more than small teams need
- Pricing needs careful volume planning
- Setup may require observability maturity
Platforms / Deployment
iOS / Android / React Native / Flutter support varies
Cloud / Hybrid
Security & Compliance
Enterprise security controls may include SSO, RBAC, audit logs, encryption, and compliance support depending on plan. Exact details should be validated before purchase.
Integrations & Ecosystem
Datadog has a large ecosystem for observability and incident management.
- Cloud providers
- Kubernetes
- Slack
- Jira
- PagerDuty
- CI/CD tools
Support & Community
Datadog has strong enterprise documentation, support tiers, onboarding resources, and a mature observability ecosystem.
#4 — New Relic Mobile Monitoring
Short description :
New Relic Mobile Monitoring helps teams track mobile app performance, crashes, errors, and user experience.It works well for organizations already using New Relic for APM, infrastructure, logs, or browser monitoring.The tool connects mobile performance with backend services and application health.
It helps teams understand app response times, network calls, errors, and release quality.It is suitable for engineering teams that want mobile monitoring inside a wider observability platform.It is a practical option for mid-market and enterprise teams.
Key Features
- Mobile app performance monitoring
- Crash and error visibility
- Network performance tracking
- App launch and interaction monitoring
- Backend service correlation
- Dashboards and alerts
- Observability platform integration
Pros
- Good for teams already using New Relic
- Connects mobile data with backend performance
- Useful for application reliability workflows
Cons
- May feel complex for simple app teams
- Pricing and data volume need planning
- Best value comes when using broader New Relic features
Platforms / Deployment
iOS / Android / mobile platforms
Cloud / Hybrid
Security & Compliance
SSO, RBAC, audit logs, encryption, and compliance support may vary by plan. Not publicly stated where exact details are unclear.
Integrations & Ecosystem
New Relic connects mobile monitoring with broader observability workflows.
- Cloud platforms
- Kubernetes
- Slack
- Jira
- PagerDuty
- CI/CD workflows
Support & Community
New Relic has mature documentation, support resources, and a strong observability user base.
#5 — Sentry
Short description :
Sentry is a developer-first platform for error monitoring, crash reporting, and performance monitoring.
It supports mobile, web, backend, and full-stack applications.For mobile teams, Sentry helps track crashes, slow transactions, releases, and user impact.It is popular among developers because it provides useful debugging context and simple workflows.Sentry is a strong choice for teams that want performance and crash data together.It works well for startups, SMBs, and larger engineering teams.
Key Features
- Mobile crash and error monitoring
- Performance monitoring and tracing
- Release tracking
- Stack traces and breadcrumbs
- User impact visibility
- Broad SDK support
- Alerting and issue workflows
Pros
- Strong developer experience
- Good balance of crash and performance monitoring
- Broad ecosystem and framework support
Cons
- Event volume may affect cost
- Advanced setup needs thoughtful configuration
- Full observability may require other tools
Platforms / Deployment
iOS / Android / React Native / Flutter / Web / backend platforms
Cloud / Self-hosted / Hybrid
Security & Compliance
SSO/SAML, MFA, RBAC, encryption, audit logs, and compliance details may vary by plan. Not publicly stated where exact claims are unclear.
Integrations & Ecosystem
Sentry has strong integrations for development and incident workflows.
- GitHub
- GitLab
- Jira
- Slack
- Microsoft Teams
- PagerDuty
Support & Community
Sentry has strong documentation, active community usage, SDK guides, and support options that vary by plan.
#6 — Instabug
Short description :
Instabug is a mobile-first platform for app performance monitoring, crash reporting, bug reporting, and user feedback.It is built for mobile product teams, QA teams, and developers who need detailed app diagnostics.Instabug helps teams find slow experiences, crashes, app hangs, and user-reported bugs.
It also connects performance issues with feedback and session context.It is useful for teams that want both technical diagnostics and user experience signals.It works especially well for mobile-focused businesses.
Key Features
- Mobile app performance monitoring
- Crash reporting
- Bug reporting and user feedback
- App hang and freeze detection
- Session and device context
- Release health visibility
- Workflow integrations
Pros
- Strong mobile-focused feature set
- Helpful for QA, product, and engineering teams
- Combines performance data with user feedback
Cons
- Less suitable for backend-only monitoring
- May be more than needed for simple apps
- Advanced workflows may require setup time
Platforms / Deployment
iOS / Android / React Native / Flutter / Varies / N/A
Cloud
Security & Compliance
Security features vary by plan. Compliance details should be validated directly. Not publicly stated where uncertain.
Integrations & Ecosystem
Instabug connects mobile diagnostics with team collaboration tools.
- Jira
- Slack
- GitHub
- Trello
- Zendesk
- APIs and webhooks
Support & Community
Instabug provides documentation, onboarding resources, and product support. Support levels may vary by plan.
#7 — Dynatrace Mobile App Monitoring
Short description :
Dynatrace Mobile App Monitoring helps enterprises monitor mobile app performance, user experience, and backend dependencies.It is part of the larger Dynatrace observability and automation platform.
The tool helps teams connect mobile issues with APIs, services, cloud infrastructure, and user journeys.
It is suitable for large organizations with complex digital systems.Dynatrace is strong when teams need AI-assisted monitoring and full-stack visibility.It is best for enterprise environments with serious performance and reliability needs.
Key Features
- Mobile real user monitoring
- Crash and error visibility
- User action and session tracking
- Backend dependency correlation
- AI-assisted anomaly detection
- Enterprise dashboards and alerts
- Full-stack observability support
Pros
- Strong enterprise observability depth
- Good for complex app and backend environments
- Useful AI-assisted diagnostics
Cons
- May be too complex for smaller teams
- Pricing and implementation need careful planning
- Best suited for mature IT and DevOps teams
Platforms / Deployment
iOS / Android / Web / cloud and enterprise environments
Cloud / Hybrid
Security & Compliance
Enterprise security controls may include SSO, RBAC, audit logs, encryption, and compliance support depending on plan. Exact details should be validated.
Integrations & Ecosystem
Dynatrace connects mobile monitoring with enterprise observability and automation workflows.
- Cloud platforms
- Kubernetes
- CI/CD tools
- Service management tools
- Incident management tools
- APIs
Support & Community
Dynatrace provides enterprise documentation, onboarding, training resources, and support tiers. Community strength is strong in enterprise observability.
#8 — AppDynamics Mobile Real User Monitoring
Short description :
AppDynamics Mobile Real User Monitoring helps teams understand mobile app performance from the user side.It tracks app crashes, network performance, user sessions, and business transaction impact.
The tool is useful for enterprises that want mobile monitoring connected with application performance management.It helps IT and engineering teams see how mobile issues affect user journeys and business outcomes.AppDynamics fits well in organizations already using enterprise APM workflows.
It is best for companies that need visibility across mobile, backend, and business transactions.
Key Features
- Mobile real user monitoring
- Crash and error visibility
- Network request tracking
- Business transaction correlation
- User session visibility
- Dashboards and alerts
- Enterprise APM integration
Pros
- Strong fit for enterprise APM users
- Connects mobile performance with business impact
- Useful for complex application environments
Cons
- May be heavy for small mobile teams
- Setup may require enterprise expertise
- Pricing and licensing should be reviewed carefully
Platforms / Deployment
iOS / Android / enterprise application environments
Cloud / Hybrid / Varies / N/A
Security & Compliance
Enterprise security controls may vary by plan and deployment. Not publicly stated where exact compliance status is unclear.
Integrations & Ecosystem
AppDynamics integrates with enterprise IT, APM, and operations workflows.
- Incident management tools
- IT service management tools
- Cloud platforms
- CI/CD workflows
- Dashboards
- APIs
Support & Community
AppDynamics has enterprise support resources, documentation, and onboarding options. Community strength is strongest among enterprise APM users.
#9 — Raygun Real User Monitoring
Short description :
Raygun Real User Monitoring helps teams understand user experience, page performance, and application issues.It is often used with error monitoring to connect software problems with real user impact.
For mobile and web product teams, Raygun can help identify slow experiences and performance bottlenecks.It is useful for SaaS teams that want practical performance visibility without overly complex tooling.Raygun works well for teams focused on user impact and app quality.
It is best for small to mid-sized teams that need simple monitoring with useful diagnostics.
Key Features
- Real user monitoring
- Error and crash visibility
- User impact analysis
- Performance dashboards
- Release tracking
- Alerting workflows
- Web and application monitoring support
Pros
- Clear user impact focus
- Good for SaaS and product teams
- Practical dashboards and monitoring views
Cons
- May not be as mobile-specialized as Embrace or Instabug
- Advanced enterprise observability may require other tools
- Platform support should be validated for specific mobile stacks
Platforms / Deployment
Web / mobile support varies / backend platforms
Cloud
Security & Compliance
Security controls and compliance details may vary by plan. Not publicly stated where exact details are unclear.
Integrations & Ecosystem
Raygun connects monitoring data with development and alerting workflows.
- Jira
- GitHub
- Slack
- Microsoft Teams
- PagerDuty
- APIs and webhooks
Support & Community
Raygun provides documentation and support resources. Community strength is moderate compared with larger observability platforms.
#10 — UXCam
Short description :
UXCam is a mobile app experience analytics platform that helps teams understand user behavior and performance-related friction.It is not only a performance monitoring tool, but it can support mobile teams by showing session behavior, screen flows, and user struggle.
It is useful for product managers, UX teams, and mobile developers who want to understand why users abandon flows.UXCam can help teams connect performance issues with user experience problems.
It works well for mobile apps where experience quality and conversion matter.
It is best when teams want behavioral insights along with technical signals.
Key Features
- Mobile session replay
- User journey analytics
- Screen flow analysis
- Rage tap and frustration signals
- Crash and issue context varies
- Funnel and retention insights
- Product experience monitoring
Pros
- Strong for mobile user behavior analysis
- Helpful for product and UX teams
- Good for finding friction in app journeys
Cons
- Not a pure engineering APM tool
- May need another tool for deep backend diagnostics
- Technical performance depth may vary by use case
Platforms / Deployment
iOS / Android / React Native / Flutter support varies
Cloud
Security & Compliance
Privacy and security controls vary by plan. Buyers should validate masking, retention, consent, and compliance requirements. Not publicly stated where unclear.
Integrations & Ecosystem
UXCam connects mobile experience insights with product and team workflows.
- Analytics workflows
- Product management tools
- Collaboration tools
- APIs
- Webhooks
- Data export options vary
Support & Community
UXCam provides documentation and onboarding resources. Support levels and community depth may vary by plan.
Comparison Table (Top 10)
| Tool Name | Best For | Platform(s) Supported | Deployment | Standout Feature | Public Rating |
|---|---|---|---|---|---|
| Firebase Performance Monitoring | Firebase-based mobile teams | iOS, Android, Flutter | Cloud | Simple mobile performance monitoring | N/A |
| Embrace | Deep mobile observability | iOS, Android | Cloud | Session-level mobile diagnostics | N/A |
| Datadog Mobile RUM | Full-stack observability teams | iOS, Android, React Native, Flutter varies | Cloud / Hybrid | Mobile data connected with logs, traces, and backend services | N/A |
| New Relic Mobile Monitoring | APM-connected mobile monitoring | iOS, Android | Cloud / Hybrid | Mobile performance linked with backend observability | N/A |
| Sentry | Developer-first mobile errors and performance | iOS, Android, React Native, Flutter, web, backend | Cloud / Self-hosted / Hybrid | Strong SDK and release tracking | N/A |
| Instabug | Mobile QA, performance, and feedback | iOS, Android, React Native, Flutter varies | Cloud | Performance monitoring plus user feedback | N/A |
| Dynatrace Mobile App Monitoring | Enterprise mobile observability | iOS, Android, Web | Cloud / Hybrid | AI-assisted full-stack monitoring | N/A |
| AppDynamics Mobile Real User Monitoring | Enterprise APM users | iOS, Android | Cloud / Hybrid / Varies | Business transaction correlation | N/A |
| Raygun Real User Monitoring | SaaS and product teams | Web, mobile support varies | Cloud | User impact-focused performance monitoring | N/A |
| UXCam | Mobile product experience analytics | iOS, Android, React Native, Flutter varies | Cloud | Session replay and user journey insights | N/A |
Evaluation & Mobile Performance Monitoring Tools
| Tool Name | Core (25%) | Ease (15%) | Integrations (15%) | Security (10%) | Performance (10%) | Support (10%) | Value (15%) | Weighted Total (0–10) |
|---|---|---|---|---|---|---|---|---|
| Firebase Performance Monitoring | 8 | 9 | 8 | 8 | 8 | 8 | 9 | 8.30 |
| Embrace | 9 | 8 | 8 | 7 | 9 | 8 | 8 | 8.20 |
| Datadog Mobile RUM | 9 | 7 | 10 | 9 | 9 | 9 | 7 | 8.55 |
| New Relic Mobile Monitoring | 8 | 7 | 9 | 9 | 9 | 9 | 7 | 8.15 |
| Sentry | 8 | 9 | 9 | 8 | 8 | 8 | 9 | 8.35 |
| Instabug | 8 | 8 | 8 | 7 | 8 | 8 | 8 | 7.95 |
| Dynatrace Mobile App Monitoring | 9 | 7 | 9 | 9 | 9 | 9 | 7 | 8.40 |
| AppDynamics Mobile RUM | 8 | 7 | 8 | 8 | 8 | 8 | 7 | 7.65 |
| Raygun Real User Monitoring | 7 | 8 | 8 | 7 | 8 | 7 | 8 | 7.55 |
| UXCam | 7 | 8 | 7 | 7 | 7 | 7 | 8 | 7.30 |
These scores are comparative and should not be treated as universal rankings. A small mobile team may value ease of use more than enterprise governance. A large enterprise may value integrations, security, and full-stack visibility more than low setup effort. Always compare tools based on your app type, traffic volume, team skills, security needs, and existing stack.
Which Mobile Performance Monitoring Tools
Solo / Freelancer
Solo developers usually need a simple tool that is easy to install and does not require heavy setup. Firebase Performance Monitoring is a strong option for Firebase-based apps. Sentry is also useful when crash and performance monitoring are both needed.
SMB
SMBs should look for easy onboarding, practical dashboards, useful alerts, and affordable scaling. Sentry, Firebase Performance Monitoring, Instabug, Raygun, and Embrace can be good choices depending on whether the team is developer-led, mobile-first, or product-led.
Mid-Market
Mid-market teams often need release health, session context, integrations, and stronger collaboration. Embrace, Sentry, Datadog Mobile RUM, New Relic Mobile Monitoring, and Instabug are good options. The decision depends on whether the team wants mobile-only depth or full-stack observability.
Enterprise
Enterprises usually need SSO, RBAC, audit logs, compliance review, data governance, scalable dashboards, and integration with incident workflows. Datadog, Dynatrace, New Relic, AppDynamics, and enterprise plans of Sentry or Embrace are suitable choices.
Budget vs Premium
Budget-focused teams can start with Firebase Performance Monitoring or Sentry depending on their platform. Premium tools like Datadog, Dynatrace, New Relic, and Embrace provide deeper observability but require stronger cost planning.
Feature Depth vs Ease of Use
Firebase Performance Monitoring is easier for simple mobile performance tracking. Sentry balances ease and engineering depth. Embrace and Instabug provide deeper mobile context. Datadog, Dynatrace, and New Relic provide broader observability but may need more setup.
Integrations & Scalability-
For integration-heavy teams, Datadog, New Relic, Dynatrace, Sentry, and AppDynamics are strong options. Teams should check integrations with CI/CD tools, issue trackers, alerting tools, analytics platforms, and backend observability systems.
Security & Compliance Needs
Security-focused teams should validate SSO, SAML, MFA, RBAC, audit logs, encryption, PII masking, data retention, and compliance documentation. Do not choose a tool only by features if your app handles financial, healthcare, or sensitive customer data.
Frequently Asked Questions (FAQs)
1. What is a mobile performance monitoring tool?
A mobile performance monitoring tool tracks how an app performs on real devices. It helps teams find slow screens, crashes, freezes, failed network calls, and release problems.
2. How is mobile performance monitoring different from mobile analytics?
Mobile analytics focuses on user behavior, events, funnels, and retention. Mobile performance monitoring focuses on speed, reliability, errors, crashes, network calls, and app health.
3. Do small mobile apps need performance monitoring?
Small apps may not need advanced monitoring at first, but basic performance and crash tracking is still useful. It helps developers catch issues before users leave negative reviews or uninstall the app.
4. What pricing models are common?
Pricing can depend on sessions, events, monthly active users, data retention, seats, traces, or observability volume. Buyers should estimate traffic and data volume before choosing a plan.
5. How long does setup take?
Basic SDK installation can be quick, but full setup may take longer. Teams may need to configure custom traces, alerts, release tracking, privacy filters, integrations, and dashboards.
6. What mistakes should teams avoid?
Common mistakes include tracking too many noisy events, ignoring slow network calls, not monitoring release changes, failing to mask sensitive data, and not assigning ownership for performance issues.
7. Are mobile performance monitoring tools secure?
Many tools provide security controls, but details vary by vendor and plan. Teams should validate encryption, access controls, data retention, PII masking, and compliance needs before sending production data.
8. Can these tools monitor backend performance too?
Some tools connect mobile data with backend traces, logs, and services. Datadog, New Relic, Dynatrace, and AppDynamics are stronger for full-stack visibility, while mobile-first tools focus more on app-side experience.
9. What integrations are most important?
Important integrations include Jira, GitHub, GitLab, Slack, Microsoft Teams, PagerDuty, CI/CD tools, crash reporting tools, analytics platforms, and backend observability systems.
10. When should a team switch tools?
A team should consider switching when the current tool lacks platform support, creates too much noise, misses key mobile context, becomes too expensive, or fails to integrate with engineering workflows.
Conclusion
Mobile performance monitoring tools help teams build faster, smoother, and more reliable apps. The right tool depends on your app type, team size, technical stack, and business goals. Firebase Performance Monitoring is practical for Firebase-based mobile teams. Sentry is strong for developer-first teams that need crash and performance visibility. Embrace and Instabug are useful for mobile-first product teams that need deeper user session context. Datadog, New Relic, Dynatrace, and AppDynamics are better for enterprises that need full-stack observability.