Introduction
GPU observability and profiling tools help teams monitor, debug, optimize, and manage GPU workloads. In simple words, these tools show how GPUs are being used, where performance is slow, why memory is full, and how applications behave during training, inference, rendering, simulation, or high-performance computing.
This category matters because GPUs are now used heavily in AI, machine learning, data science, gaming, 3D rendering, scientific computing, cloud workloads, and enterprise infrastructure. Without proper visibility, teams may waste expensive GPU capacity, face slow model training, miss performance bottlenecks, or struggle to troubleshoot production issues.
Common use cases include:
- Monitoring GPU utilization across servers and clusters
- Profiling AI model training and inference workloads
- Detecting memory bottlenecks and kernel-level inefficiencies
- Tracking GPU health, temperature, power, and errors
- Improving cost efficiency in cloud GPU environments
Buyers should evaluate:
- GPU metrics depth
- Profiling detail
- Kubernetes and cloud support
- AI/ML framework support
- Alerting and dashboards
- Developer debugging workflow
- Enterprise monitoring integration
- Ease of setup
- Scalability
- Cost visibility
Best for: AI engineers, ML platform teams, DevOps teams, SRE teams, data science teams, HPC teams, cloud architects, gaming studios, and enterprises running GPU-heavy workloads.
Not ideal for: teams with very small GPU usage, simple CPU-only workloads, or users who only need basic system monitoring without GPU-level performance details.
Key Trends in GPU Observability & Profiling Tools
- AI workload monitoring is becoming a core requirement because training and inference workloads are expensive and performance-sensitive.
- GPU cost optimization is now a major priority, especially for cloud teams using rented accelerators.
- Kubernetes-native GPU monitoring is growing, as more AI workloads run on container platforms.
- Real-time inference observability is becoming important, especially for production AI services.
- Profiling is moving closer to developer workflows, helping engineers tune models, kernels, memory usage, and batch sizes.
- Full-stack visibility is expected, from GPU hardware metrics to application latency and model performance.
- Open-source monitoring stacks are widely used, especially Prometheus, Grafana, and exporter-based GPU metrics.
- Enterprise observability platforms are adding GPU support, so GPU data can be viewed with infrastructure, logs, traces, and application metrics.
- Memory profiling is critical, because GPU memory pressure is one of the most common causes of failed or slow workloads.
- Multi-GPU and distributed training visibility is now essential for teams scaling AI workloads across clusters.
How We Selected These Tools
These tools were selected based on:
- Recognition in GPU, AI, ML, cloud, and observability communities
- Practical usefulness for monitoring or profiling GPU workloads
- Support for production or development workflows
- Ability to expose GPU utilization, memory, power, temperature, and errors
- Fit for cloud, Kubernetes, workstation, or enterprise environments
- Integration with AI/ML frameworks and infrastructure platforms
- Developer debugging and performance tuning value
- Enterprise readiness where applicable
- Community adoption and documentation strength
- Balanced coverage across observability, profiling, and monitoring use cases
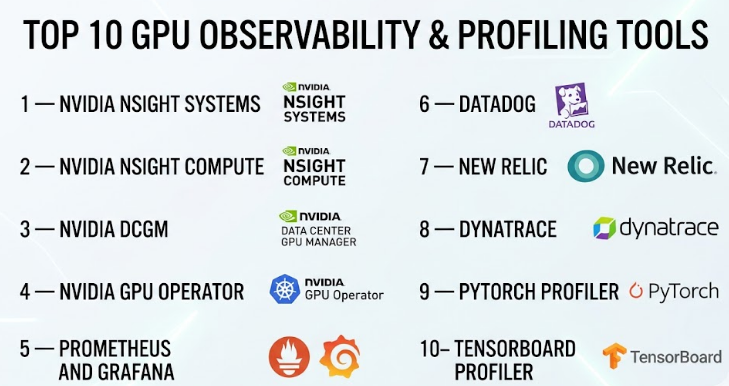
Top 10 GPU Observability & Profiling Tools
#1 — NVIDIA Nsight Systems
Short description :
NVIDIA Nsight Systems is a performance analysis tool for developers working on GPU-accelerated applications. It helps teams understand system-wide performance across CPU, GPU, memory, threads, APIs, and workloads. It is especially useful for AI, HPC, graphics, robotics, and simulation teams. Developers use it to find bottlenecks, analyze timelines, and improve end-to-end workload performance. It is more of a deep profiling tool than a simple dashboard tool.
Key Features
- System-wide performance timeline analysis
- CPU and GPU activity tracing
- CUDA workload analysis
- Thread and process behavior visibility
- Multi-GPU performance support
- Useful for AI, HPC, and graphics workloads
- Helps identify performance gaps across the full system
Pros
- Very strong for deep GPU workload profiling
- Useful for complex performance troubleshooting
- Trusted option for NVIDIA GPU environments
Cons
- Requires technical skill to use effectively
- Not a simple business dashboard tool
- Best suited for development and optimization workflows
Platforms / Deployment
Windows / Linux / macOS
Self-hosted / Local workstation
Security & Compliance
Not publicly stated.
Integrations & Ecosystem
NVIDIA Nsight Systems fits strongly into NVIDIA’s developer ecosystem. It is commonly used with CUDA-based workloads, AI frameworks, and high-performance computing applications.
- CUDA applications
- NVIDIA GPUs
- AI/ML workloads
- HPC workloads
- Developer debugging workflows
- Performance optimization pipelines
Support & Community
NVIDIA provides documentation, technical guides, developer resources, and community support. Enterprise support may depend on NVIDIA product agreements.
#2 — NVIDIA Nsight Compute
Short description :
NVIDIA Nsight Compute is a detailed GPU kernel profiler for CUDA applications. It helps developers analyze kernel execution, memory behavior, compute efficiency, occupancy, and low-level GPU performance. It is best for engineering teams that need deep technical profiling rather than basic monitoring. AI engineers, CUDA developers, HPC teams, and performance engineers use it to optimize GPU code and improve execution efficiency.
Key Features
- Detailed CUDA kernel profiling
- GPU memory analysis
- Compute efficiency metrics
- Occupancy and instruction-level insights
- Source-level correlation
- Performance rule guidance
- Useful for low-level GPU optimization
Pros
- Excellent for CUDA kernel-level analysis
- Helps improve GPU code efficiency
- Strong fit for technical performance engineers
Cons
- Not designed for non-technical users
- Mainly useful for NVIDIA CUDA workflows
- Requires profiling knowledge to interpret results
Platforms / Deployment
Windows / Linux
Self-hosted / Local workstation
Security & Compliance
Not publicly stated.
Integrations & Ecosystem
Nsight Compute works closely with CUDA development workflows and NVIDIA GPU software stacks.
- CUDA
- NVIDIA GPUs
- HPC applications
- AI model optimization workflows
- Developer IDE workflows
- Low-level GPU debugging
Support & Community
NVIDIA provides documentation, developer guidance, examples, and community support. Support level may vary based on NVIDIA enterprise agreements.
#3 — NVIDIA DCGM
Short description :
NVIDIA Data Center GPU Manager, commonly called DCGM, is a monitoring and management tool for NVIDIA data center GPUs. It helps infrastructure teams collect GPU health, utilization, temperature, power, memory, and error metrics. It is widely used in GPU clusters, AI platforms, and Kubernetes environments. DCGM is especially useful for DevOps, SRE, platform engineering, and data center teams managing GPU infrastructure at scale.
Key Features
- GPU health monitoring
- Utilization, memory, power, and temperature metrics
- Error and diagnostic reporting
- Data center GPU management
- Prometheus exporter support
- Useful for Kubernetes and cluster monitoring
- Strong fit for production GPU infrastructure
Pros
- Practical for production GPU monitoring
- Strong NVIDIA data center GPU support
- Works well with observability stacks
Cons
- Focused mainly on NVIDIA GPUs
- Not a complete APM platform by itself
- Requires integration for dashboards and alerts
Platforms / Deployment
Linux / Kubernetes
Self-hosted / Hybrid
Security & Compliance
Not publicly stated.
Integrations & Ecosystem
DCGM is commonly integrated into monitoring stacks to expose GPU metrics for dashboards and alerts.
- Prometheus
- Grafana
- Kubernetes
- NVIDIA GPU Operator
- Data center GPU infrastructure
- AI/ML clusters
Support & Community
NVIDIA provides documentation and enterprise ecosystem support. Community usage is strong in Kubernetes and AI infrastructure environments.
#4 — NVIDIA GPU Operator
Short description :
NVIDIA GPU Operator helps teams run and manage NVIDIA GPU software components on Kubernetes. It automates deployment of drivers, device plugins, monitoring components, and GPU-related services. It is useful for platform teams building AI, ML, HPC, or GPU-enabled Kubernetes clusters. While it is not only an observability tool, it plays an important role in enabling GPU monitoring and operational visibility in Kubernetes environments.
Key Features
- Kubernetes-native GPU management
- Automated driver and runtime deployment
- Device plugin support
- DCGM integration
- GPU monitoring enablement
- Useful for AI/ML platforms
- Supports scalable GPU cluster operations
Pros
- Reduces manual GPU setup work in Kubernetes
- Strong fit for platform engineering teams
- Works well with NVIDIA monitoring components
Cons
- Kubernetes knowledge is required
- Mostly relevant for NVIDIA GPU environments
- Not a standalone observability dashboard
Platforms / Deployment
Linux / Kubernetes
Self-hosted / Hybrid / Cloud
Security & Compliance
Not publicly stated.
Integrations & Ecosystem
NVIDIA GPU Operator connects GPU infrastructure with Kubernetes-native operations and monitoring.
- Kubernetes
- NVIDIA DCGM
- Prometheus
- Grafana
- Container runtimes
- AI/ML platforms
Support & Community
NVIDIA provides documentation and enterprise ecosystem support. Community adoption is strong among Kubernetes-based GPU teams.
#5 — Prometheus and Grafana
Short description :
Prometheus and Grafana are widely used open-source tools for collecting, storing, visualizing, and alerting on infrastructure metrics. For GPU observability, teams commonly use exporters such as DCGM Exporter to collect GPU metrics and display them in Grafana dashboards. This combination is popular with DevOps, SRE, platform engineering, and AI infrastructure teams. It is flexible, cost-effective, and highly customizable.
Key Features
- Time-series metrics collection
- GPU dashboards through exporters
- Alerting rules and notifications
- Kubernetes-friendly monitoring
- Custom dashboard creation
- Strong open-source ecosystem
- Works across infrastructure and application metrics
Pros
- Flexible and widely adopted
- Strong dashboard and alerting capabilities
- Good fit for Kubernetes and infrastructure teams
Cons
- Requires setup and maintenance
- GPU depth depends on exporters used
- Large-scale operations need careful planning
Platforms / Deployment
Windows / Linux / macOS / Kubernetes
Cloud / Self-hosted / Hybrid
Security & Compliance
Security and compliance depend on deployment, configuration, access control, hosting model, and enterprise edition if used. Not publicly stated for every setup.
Integrations & Ecosystem
Prometheus and Grafana have a broad ecosystem for infrastructure observability.
- DCGM Exporter
- Kubernetes
- Alertmanager
- Cloud monitoring systems
- Logs and traces through related tools
- Infrastructure exporters
Support & Community
Very strong community, extensive documentation, plugins, dashboards, and enterprise support options depending on vendor and deployment.
#6 — Datadog
Short description :
Datadog is a cloud observability platform used for infrastructure monitoring, application monitoring, logs, traces, security signals, and cloud visibility. For GPU workloads, Datadog can help teams monitor infrastructure metrics, container environments, Kubernetes clusters, and GPU-related telemetry through integrations. It is best for organizations that want GPU visibility inside a broader enterprise observability platform rather than managing a separate monitoring stack.
Key Features
- Infrastructure monitoring
- Kubernetes and container visibility
- Dashboards and alerting
- Logs, metrics, and traces in one platform
- Cloud environment monitoring
- GPU metric support through integrations
- Enterprise observability workflows
Pros
- Strong full-stack observability platform
- Useful for production monitoring and alerting
- Good fit for cloud and Kubernetes teams
Cons
- Pricing can become complex at scale
- GPU profiling depth may not match specialist tools
- Requires careful configuration for cost control
Platforms / Deployment
Cloud / Windows / Linux / macOS / Kubernetes
Cloud / Hybrid
Security & Compliance
Datadog provides enterprise security controls and compliance-related features, but exact certification needs should be verified by the buyer. If uncertain, write Not publicly stated for specific compliance needs.
Integrations & Ecosystem
Datadog has a large integration ecosystem for cloud, containers, infrastructure, and application monitoring.
- Kubernetes
- Cloud platforms
- Containers
- Logs and traces
- Infrastructure metrics
- Alerting tools
Support & Community
Datadog provides documentation, onboarding resources, customer support, training materials, and enterprise support plans.
#7 — New Relic
Short description :
New Relic is an observability platform that helps teams monitor applications, infrastructure, logs, traces, Kubernetes, cloud systems, and user experience. For GPU-heavy workloads, New Relic can be useful when teams want GPU metrics alongside application and infrastructure telemetry. It is a good fit for engineering teams that want to connect application performance with infrastructure behavior, especially in cloud-native environments.
Key Features
- Infrastructure monitoring
- Application performance monitoring
- Logs, metrics, and traces
- Kubernetes monitoring
- Custom dashboards
- Alerting and incident workflows
- GPU metrics through supported integrations or custom telemetry
Pros
- Strong full-stack observability coverage
- Useful for connecting app and infrastructure signals
- Flexible dashboards and telemetry ingestion
Cons
- GPU-specific profiling is not its main focus
- Setup quality depends on telemetry configuration
- Pricing and data volume should be reviewed carefully
Platforms / Deployment
Cloud / Windows / Linux / macOS / Kubernetes
Cloud / Hybrid
Security & Compliance
New Relic offers enterprise security capabilities, but specific compliance requirements should be validated by buyers. Not publicly stated for every GPU use case.
Integrations & Ecosystem
New Relic fits well into cloud-native and application monitoring environments.
- Kubernetes
- Cloud platforms
- Application frameworks
- Logs and traces
- Infrastructure agents
- Custom telemetry pipelines
Support & Community
New Relic provides documentation, onboarding support, community resources, and enterprise support depending on plan.
#8 — Dynatrace
Short description :
Dynatrace is an enterprise observability and automation platform used for application monitoring, infrastructure monitoring, cloud visibility, security insights, and AI-assisted operations. For GPU environments, it can help enterprises observe infrastructure and workload behavior as part of broader digital performance monitoring. It is best suited for larger organizations that need automated discovery, enterprise governance, and full-stack operational visibility.
Key Features
- Full-stack observability
- Infrastructure and application monitoring
- Cloud and Kubernetes visibility
- AI-assisted root cause analysis
- Dashboards and alerts
- Enterprise governance support
- Custom metrics for specialized environments
Pros
- Strong enterprise observability capabilities
- Helpful for complex environments
- Good automation and root cause analysis features
Cons
- May be more than small teams need
- GPU profiling depth depends on setup
- Cost and implementation planning are important
Platforms / Deployment
Cloud / Windows / Linux / Kubernetes
Cloud / Hybrid
Security & Compliance
Dynatrace offers enterprise security and compliance-oriented features, but buyers should validate exact certifications and requirements. Not publicly stated for every GPU-specific case.
Integrations & Ecosystem
Dynatrace integrates with enterprise infrastructure, cloud platforms, and application environments.
- Kubernetes
- Cloud platforms
- Enterprise applications
- Logs and metrics
- Automation workflows
- Custom telemetry sources
Support & Community
Dynatrace provides enterprise support, documentation, onboarding resources, and customer success options depending on plan.
#9 — PyTorch Profiler
Short description :
PyTorch Profiler is a profiling tool for teams building and optimizing machine learning models with PyTorch. It helps developers understand CPU and GPU performance, operator execution, memory usage, and training bottlenecks. It is especially useful for ML engineers, researchers, and data scientists who want to improve model training speed and GPU efficiency. It is not a general infrastructure monitoring platform, but it is very valuable for ML workload optimization.
Key Features
- PyTorch model profiling
- CPU and GPU activity analysis
- Operator-level performance visibility
- Memory profiling support
- Training bottleneck detection
- TensorBoard integration support
- Useful for model optimization workflows
Pros
- Strong fit for PyTorch teams
- Helps optimize training performance
- Useful for developer-level investigation
Cons
- Limited outside PyTorch workflows
- Not a production observability platform by itself
- Requires ML profiling knowledge
Platforms / Deployment
Windows / Linux / macOS
Self-hosted / Local / Hybrid
Security & Compliance
Not publicly stated.
Integrations & Ecosystem
PyTorch Profiler is part of the broader PyTorch ecosystem and works well in ML development workflows.
- PyTorch
- TensorBoard
- CUDA workflows
- Model training pipelines
- ML experimentation tools
- Research environments
Support & Community
PyTorch has strong documentation, community support, examples, and broad adoption among ML engineers and researchers.
#10 — TensorBoard Profiler
Short description :
TensorBoard Profiler helps machine learning teams profile TensorFlow workloads and understand model performance. It provides visibility into training steps, input pipelines, GPU utilization, memory behavior, and operation timing. It is useful for data scientists, ML engineers, and researchers using TensorFlow. Like PyTorch Profiler, it is more focused on model-level profiling than infrastructure-wide GPU observability.
Key Features
- TensorFlow workload profiling
- GPU utilization insights
- Input pipeline analysis
- Training step performance visibility
- Memory and operation timing details
- Visual profiling dashboards
- Useful for ML model optimization
Pros
- Strong fit for TensorFlow users
- Helpful visual profiling interface
- Useful for finding model training bottlenecks
Cons
- Mainly focused on TensorFlow workflows
- Not a full enterprise monitoring system
- Less useful for non-ML GPU workloads
Platforms / Deployment
Windows / Linux / macOS
Self-hosted / Local / Hybrid
Security & Compliance
Not publicly stated.
Integrations & Ecosystem
TensorBoard Profiler fits naturally into TensorFlow development and experimentation workflows.
- TensorFlow
- TensorBoard
- CUDA-enabled training
- ML experiments
- Model optimization workflows
- Research pipelines
Support & Community
TensorFlow and TensorBoard have strong documentation, tutorials, community support, and broad use in machine learning environments.
Comparison Table
| Tool Name | Best For | Platform(s) Supported | Deployment | Standout Feature | Public Rating |
|---|---|---|---|---|---|
| NVIDIA Nsight Systems | End-to-end GPU workload profiling | Windows, Linux, macOS | Self-hosted / Local | System-wide CPU and GPU timeline analysis | N/A |
| NVIDIA Nsight Compute | CUDA kernel-level optimization | Windows, Linux | Self-hosted / Local | Deep GPU kernel profiling | N/A |
| NVIDIA DCGM | Data center GPU monitoring | Linux, Kubernetes | Self-hosted / Hybrid | GPU health and utilization metrics | N/A |
| NVIDIA GPU Operator | Kubernetes GPU operations | Linux, Kubernetes | Self-hosted / Hybrid / Cloud | Automated GPU software management | N/A |
| Prometheus and Grafana | Open-source GPU monitoring dashboards | Windows, Linux, macOS, Kubernetes | Cloud / Self-hosted / Hybrid | Flexible metrics and dashboards | N/A |
| Datadog | Enterprise cloud GPU observability | Windows, Linux, macOS, Kubernetes | Cloud / Hybrid | Full-stack observability with GPU metrics | N/A |
| New Relic | App and infrastructure visibility | Windows, Linux, macOS, Kubernetes | Cloud / Hybrid | Unified telemetry and dashboards | N/A |
| Dynatrace | Large enterprise observability | Windows, Linux, Kubernetes | Cloud / Hybrid | AI-assisted root cause analysis | N/A |
| PyTorch Profiler | PyTorch model optimization | Windows, Linux, macOS | Self-hosted / Local / Hybrid | Operator-level ML profiling | N/A |
| TensorBoard Profiler | TensorFlow model profiling | Windows, Linux, macOS | Self-hosted / Local / Hybrid | Visual ML training performance analysis | N/A |
Evaluation & GPU Observability & Profiling Tools
| Tool Name | Core (25%) | Ease (15%) | Integrations (15%) | Security (10%) | Performance (10%) | Support (10%) | Value (15%) | Weighted Total |
|---|---|---|---|---|---|---|---|---|
| NVIDIA Nsight Systems | 9 | 7 | 8 | 7 | 10 | 8 | 9 | 8.40 |
| NVIDIA Nsight Compute | 9 | 6 | 8 | 7 | 10 | 8 | 9 | 8.25 |
| NVIDIA DCGM | 9 | 7 | 9 | 7 | 9 | 8 | 9 | 8.40 |
| NVIDIA GPU Operator | 8 | 7 | 9 | 7 | 8 | 8 | 8 | 7.95 |
| Prometheus and Grafana | 8 | 7 | 10 | 7 | 8 | 9 | 10 | 8.45 |
| Datadog | 8 | 8 | 9 | 8 | 8 | 9 | 7 | 8.10 |
| New Relic | 7 | 8 | 8 | 8 | 8 | 8 | 7 | 7.60 |
| Dynatrace | 8 | 7 | 8 | 9 | 8 | 9 | 6 | 7.75 |
| PyTorch Profiler | 8 | 7 | 8 | 6 | 9 | 8 | 10 | 8.05 |
| TensorBoard Profiler | 8 | 7 | 8 | 6 | 9 | 8 | 10 | 8.05 |
These scores are comparative and depend on use case. A tool with a lower total may still be the best fit for a specific workload. For example, PyTorch Profiler is excellent for PyTorch model optimization, while Datadog is better for broad production observability. Teams should use the scores as a shortlist guide, not as a universal ranking.
Which GPU Observability & Profiling Tool Should You Choose?
Solo / Freelancer
Solo AI developers, researchers, and freelancers should start with tools that match their framework and hardware. For PyTorch work, PyTorch Profiler is practical. For TensorFlow work, TensorBoard Profiler is useful. If the goal is CUDA-level optimization, NVIDIA Nsight Systems and Nsight Compute are strong choices. Prometheus and Grafana may be too much unless the user manages servers or repeat workloads.
SMB
Small businesses should focus on visibility without heavy operational overhead. Prometheus and Grafana are good for teams with DevOps skills. Datadog or New Relic may be better if the team wants managed observability with less infrastructure maintenance. NVIDIA DCGM is valuable if the business runs NVIDIA GPUs in servers or Kubernetes clusters.
Mid-Market
Mid-market teams usually need both infrastructure monitoring and workload profiling. NVIDIA DCGM with Prometheus and Grafana is a strong technical stack. Datadog or New Relic can simplify observability across apps, cloud, and infrastructure. ML teams should still use PyTorch Profiler or TensorBoard Profiler for model-level optimization.
Enterprise
Enterprises should focus on scalability, governance, support, security, and integration with existing observability platforms. Dynatrace, Datadog, and New Relic are strong for broad enterprise observability. NVIDIA DCGM and GPU Operator are useful for GPU cluster operations. Nsight tools remain important for performance engineering and advanced development teams.
Budget vs Premium
Open-source and vendor-provided tools such as Prometheus, Grafana, DCGM, Nsight, PyTorch Profiler, and TensorBoard Profiler can offer strong value. Premium observability platforms such as Datadog, New Relic, and Dynatrace reduce operational burden and improve enterprise workflows, but pricing should be reviewed carefully based on data volume, hosts, containers, logs, and retention.
Feature Depth vs Ease of Use
Nsight Compute and Nsight Systems provide deep technical insight but require skill. Prometheus and Grafana are flexible but need setup. Datadog, New Relic, and Dynatrace are easier for enterprise dashboards and alerting. PyTorch Profiler and TensorBoard Profiler are easier for ML developers already working inside those ecosystems.
Integrations & Scalability
For Kubernetes GPU clusters, NVIDIA GPU Operator, DCGM, Prometheus, and Grafana form a strong stack. For enterprise-scale observability, Datadog, New Relic, or Dynatrace may fit better. For ML framework-level visibility, PyTorch Profiler and TensorBoard Profiler are more relevant than general infrastructure tools.
Security & Compliance Needs
Security-sensitive teams should evaluate access control, data retention, encryption, identity integration, audit logs, and deployment model. Enterprise platforms may provide stronger governance options, while open-source stacks require careful configuration. For regulated workloads, buyers should validate compliance requirements directly instead of assuming coverage.
Frequently Asked Questions
1. What are GPU observability tools?
GPU observability tools monitor GPU health, utilization, memory, power, temperature, errors, and workload behavior. They help teams understand whether GPUs are running efficiently or wasting expensive compute resources.
2. What are GPU profiling tools?
GPU profiling tools analyze how GPU workloads perform at a deeper level. They help developers find slow kernels, memory bottlenecks, poor utilization, inefficient model operations, and performance gaps in GPU-accelerated applications.
3. What is the difference between monitoring and profiling?
Monitoring is used for ongoing visibility in production or infrastructure environments. Profiling is used for deeper performance investigation during development, tuning, or troubleshooting. Most serious GPU teams need both.
4. Which tool is best for NVIDIA GPU monitoring?
NVIDIA DCGM is a strong choice for monitoring NVIDIA data center GPUs. It is commonly used with Prometheus and Grafana for dashboards and alerts in production infrastructure.
5. Which tool is best for CUDA profiling?
NVIDIA Nsight Systems and NVIDIA Nsight Compute are strong choices for CUDA profiling. Nsight Systems gives system-wide timeline visibility, while Nsight Compute focuses deeply on GPU kernel-level analysis.
6. Which tool is best for PyTorch workloads?
PyTorch Profiler is a practical choice for PyTorch workloads. It helps analyze CPU and GPU activity, operator performance, memory usage, and training bottlenecks.
7. Which tool is best for TensorFlow workloads?
TensorBoard Profiler is a strong fit for TensorFlow users. It helps visualize training performance, input pipeline issues, GPU usage, and operation-level behavior.
8. Can Prometheus and Grafana monitor GPUs?
Yes, Prometheus and Grafana can monitor GPUs when paired with suitable exporters such as NVIDIA DCGM Exporter. This setup is popular for Kubernetes and infrastructure monitoring.
9. Are premium observability platforms better than open-source tools?
Premium tools are often easier to manage and better for enterprise workflows. Open-source tools can be more flexible and cost-effective, but they require setup, maintenance, and technical ownership.
10. What are common mistakes when monitoring GPUs?
Common mistakes include only checking GPU utilization, ignoring memory usage, not tracking errors, missing temperature and power metrics, failing to monitor per-container usage, and not connecting GPU metrics to application performance.
Conclusion
GPU observability and profiling tools are now essential for teams running AI, machine learning, HPC, rendering, simulation, and GPU-powered production workloads. The best tool depends on the problem you are trying to solve. NVIDIA Nsight Systems and Nsight Compute are excellent for deep performance profiling. NVIDIA DCGM and GPU Operator are strong for GPU infrastructure and Kubernetes operations. Prometheus and Grafana provide flexible open-source monitoring, while Datadog, New Relic, and Dynatrace support broader enterprise observability. PyTorch Profiler and TensorBoard Profiler are valuable for model-level optimization.