
Prometheus and Grafana have emerged as indispensable tools in the DevOps landscape, offering unmatched capabilities in monitoring, visualization, and alerting. As organizations increasingly adopt cloud-native and microservices architectures, the demand for skilled professionals proficient in Prometheus and Grafana continues to soar. This certification program offered by DevOpsSchool not only equips you with the expertise to manage these tools but also provides a comprehensive understanding of their integration for effective monitoring and visualization solutions.
Course and Certification Overview
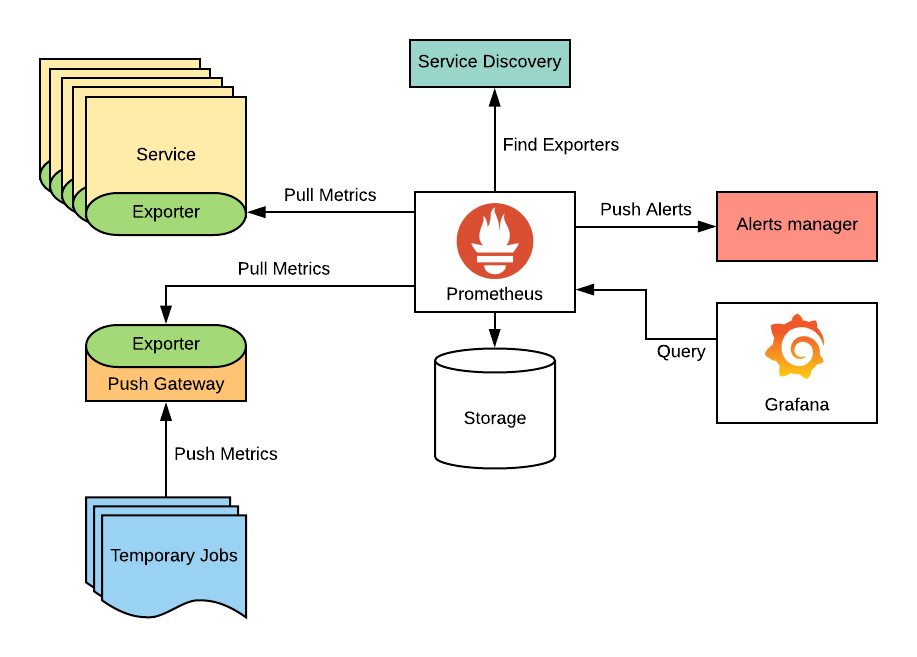
The Prometheus with Grafana Certification Program by DevOpsSchool is meticulously designed to cater to both beginners and experienced professionals. Governed and mentored by Rajesh Kumar, a prominent DevOps architect and trainer, this program promises in-depth learning and practical exposure.
Course Highlights:
- Comprehensive Curriculum: Covers Prometheus architecture, data model, Grafana integration, advanced visualization techniques, and alert management.
- Hands-On Labs: Practical sessions to apply your knowledge in real-world scenarios.
- Industry-Recognized Certification: Validate your skills with a globally acknowledged credential.
- Expert Mentorship: Learn from Rajesh Kumar, who brings over two decades of experience in DevOps training and implementation.
Course Outline
Module 1: Introduction to Prometheus
- Overview of Monitoring and Alerting Tools
- Prometheus Features and Benefits
- Installing and Configuring Prometheus
Module 2: Prometheus Architecture and Data Model
- Understanding the Prometheus Server
- Data Retrieval with Exporters
- Querying with PromQL
Module 3: Grafana Basics
- Setting up Grafana
- Dashboard Creation and Visualization
- Integrating Prometheus with Grafana
Module 4: Advanced Visualization Techniques
- Customizing Dashboards
- Managing Data Sources
- Automating Alerts and Notifications
Module 5: Real-World Use Cases
- Monitoring Kubernetes Clusters
- Application and Infrastructure Monitoring
Module 6: Certification Preparation
- Mock Tests and Quizzes
- Expert Tips for Exam Success
Certification Agenda
- Duration: 5 Days
- Mode: Online/Offline
- Assessment: Practical and Theoretical Examination
Frequently Asked Questions
1. Who is this course for?
- IT professionals, DevOps engineers, and system administrators looking to enhance their monitoring skills.
2. What are the prerequisites?
- Basic knowledge of Linux and DevOps tools is recommended but not mandatory.
3. Is the certification globally recognized?
- Yes, the DevOpsSchool certification is acknowledged by leading organizations worldwide.
4. Will I receive post-course support?
- Yes, the program offers access to a community forum and periodic webinars for continued learning.
5. Are there group discounts available?
- Yes, discounts are available for corporate and group enrollments.
Trainer Profile: Rajesh Kumar
Rajesh Kumar is a celebrated name in the DevOps domain. With over 20 years of experience in implementing and mentoring DevOps practices, Rajesh has trained professionals from leading organizations worldwide. His practical approach and industry insights make him an exceptional mentor for this certification program. Learn more about him at www.rajeshkumar.xyz.
Comparing Top Prometheus with Grafana Certifications
| Criteria | DevOpsSchool Certification | Udemy Certifications |
|---|---|---|
| Curriculum Coverage | Comprehensive | Limited |
| Trainer Expertise | Highly Experienced (Rajesh Kumar) | Variable |
| Practical Labs | Yes | Limited or None |
| Global Recognition | Yes | Variable |
| Post-Course Support | Yes | No |
| Affordability | Cost-Effective | Expensive |
| Mode of Training | Flexible (Online/Offline) | Fixed (Mostly Online) |
Conclusion
The Prometheus with Grafana Certification Program by DevOpsSchool is an unmatched opportunity to elevate your DevOps career. Whether you are starting your journey or looking to solidify your expertise, this program ensures you stay ahead in the competitive DevOps field. Enroll today and unlock the potential of Prometheus and Grafana for efficient monitoring and visualization!
