Introduction
Synthetic Monitoring Tools are platforms that simulate user interactions with applications, APIs, or websites to proactively test performance, availability, and functionality. In simple terms, they act like “virtual users” that continuously check whether your systems are working as expected—even before real users are impacted.
In modern digital environments where uptime, speed, and user experience directly impact revenue and brand reputation, synthetic monitoring has become essential. Unlike real user monitoring, which depends on actual traffic, synthetic monitoring allows teams to detect issues early by running scheduled tests across different geographies and environments.
Common use cases include:
- Monitoring website uptime and response times
- Testing critical user journeys (login, checkout, search)
- API performance and availability checks
- SLA validation and compliance monitoring
- Pre-deployment and post-release testing
Key evaluation criteria:
- Scripted and browser-based monitoring capabilities
- Global test locations and coverage
- Real-time alerts and notifications
- Integration with APM and observability tools
- Ease of test creation and maintenance
- Support for APIs and multi-step transactions
- Reporting and visualization
- Scalability and performance
- Security and compliance features
- Pricing and flexibility
Best for: DevOps teams, SREs, QA engineers, and organizations running customer-facing applications.
Not ideal for: Static websites or applications where uptime and performance are not business-critical.
Key Trends in Synthetic Monitoring Tools
- AI-driven anomaly detection: Automatically identifying unusual performance patterns
- Shift-left testing: Running synthetic tests earlier in development cycles
- Full-stack observability integration: Combining synthetic data with real user and APM data
- Global monitoring expansion: Testing from multiple regions and devices
- Low-code test creation: Simplifying script development
- API-first monitoring: Increasing focus on API performance testing
- Cloud-native deployments: Integration with Kubernetes and serverless
- Real-time alerting improvements: Faster incident detection
- Cost optimization: Smarter scheduling and sampling
- Security testing convergence: Monitoring availability and security posture together
How We Selected These Tools (Methodology)
We evaluated Synthetic Monitoring Tools based on:
- Market adoption and credibility
- Feature completeness (browser, API, uptime monitoring)
- Ease of use and scripting capabilities
- Integration with observability and DevOps tools
- Global coverage and scalability
- Security and compliance features
- Visualization and reporting quality
- Community and vendor support
- Flexibility and customization
- Overall value for cost
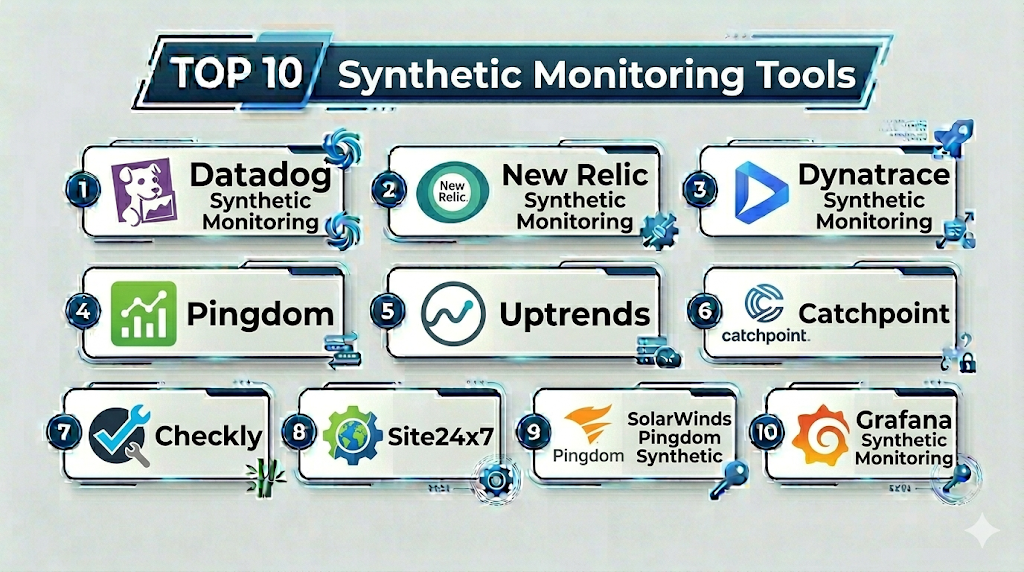
Top 10 Synthetic Monitoring Tools
#1 — Datadog Synthetic Monitoring
Short description: A cloud-based synthetic monitoring solution offering browser and API testing integrated with Datadog’s observability platform.
Key Features
- Browser and API tests
- Global test locations
- Real-time alerts
- Integration with APM and logs
- CI/CD integration
- Visual test builder
Pros
- Seamless integration with observability stack
- Scalable and flexible
Cons
- Pricing can scale quickly
- Requires Datadog ecosystem
Platforms / Deployment
Cloud
Security & Compliance
RBAC, encryption, audit logs
Integrations & Ecosystem
Datadog integrates with modern DevOps and cloud tools.
- AWS, Azure, GCP
- CI/CD pipelines
- Kubernetes
Support & Community
Strong vendor support.
#2 — New Relic Synthetic Monitoring
Short description: A synthetic monitoring solution within New Relic for tracking uptime and user journeys.
Key Features
- Scripted browser monitoring
- API monitoring
- Global locations
- Alerting
- Integration with APM
Pros
- Easy to use
- Unified observability
Cons
- Pricing complexity
- Limited outside New Relic
Platforms / Deployment
Cloud
Security & Compliance
SSO, RBAC, encryption
Integrations & Ecosystem
Works within New Relic ecosystem.
- APM
- Logs
- Infrastructure monitoring
Support & Community
Strong support.
#3 — Dynatrace Synthetic Monitoring
Short description: An AI-driven synthetic monitoring tool offering advanced insights and automation.
Key Features
- Browser and HTTP monitoring
- AI-powered insights
- Global monitoring locations
- Performance analytics
- Integration with Dynatrace platform
Pros
- Advanced analytics
- Automated insights
Cons
- Premium pricing
- Complex setup
Platforms / Deployment
Cloud
Security & Compliance
RBAC, encryption, audit logs
Integrations & Ecosystem
Integrates with enterprise observability ecosystems.
- Cloud platforms
- DevOps tools
Support & Community
Enterprise support.
#4 — Pingdom
Short description: A popular uptime and synthetic monitoring tool focused on simplicity and performance tracking.
Key Features
- Uptime monitoring
- Transaction monitoring
- Real user monitoring
- Alerting
- Performance insights
Pros
- Easy to use
- Reliable uptime checks
Cons
- Limited advanced features
- Less suited for complex workflows
Platforms / Deployment
Cloud
Security & Compliance
Not publicly stated
Integrations & Ecosystem
Pingdom integrates with monitoring and alerting tools.
- Incident management tools
- APIs
Support & Community
Good support.
#5 — Uptrends
Short description: A synthetic monitoring platform offering global monitoring and detailed performance insights.
Key Features
- Browser monitoring
- API monitoring
- Global checkpoints
- Multi-step transactions
- Alerting
Pros
- Strong global coverage
- Detailed reporting
Cons
- UI can be complex
- Pricing tiers
Platforms / Deployment
Cloud
Security & Compliance
Not publicly stated
Integrations & Ecosystem
Uptrends integrates with DevOps and monitoring tools.
- APIs
- Alerting systems
Support & Community
Vendor support available.
#6 — Catchpoint
Short description: An enterprise-grade monitoring platform offering synthetic monitoring and performance analytics.
Key Features
- Synthetic monitoring
- Internet performance monitoring
- Global nodes
- Real-time analytics
- API testing
Pros
- Enterprise-level insights
- Extensive global coverage
Cons
- Expensive
- Complex setup
Platforms / Deployment
Cloud
Security & Compliance
RBAC, encryption
Integrations & Ecosystem
Integrates with enterprise monitoring ecosystems.
- APM tools
- DevOps tools
Support & Community
Enterprise support.
#7 — Checkly
Short description: A developer-first synthetic monitoring tool for API and browser checks.
Key Features
- API monitoring
- Browser checks
- CI/CD integration
- JavaScript-based scripting
- Alerting
Pros
- Developer-friendly
- Easy automation
Cons
- Limited enterprise features
- Smaller ecosystem
Platforms / Deployment
Cloud
Security & Compliance
Not publicly stated
Integrations & Ecosystem
Checkly integrates with developer tools and pipelines.
- CI/CD tools
- APIs
Support & Community
Growing community.
#8 — Site24x7
Short description: A full-stack monitoring platform with synthetic monitoring capabilities.
Key Features
- Website monitoring
- API monitoring
- Multi-step transactions
- Global locations
- Alerting
Pros
- All-in-one platform
- Cost-effective
Cons
- UI complexity
- Limited advanced analytics
Platforms / Deployment
Cloud
Security & Compliance
RBAC, encryption
Integrations & Ecosystem
Integrates with IT monitoring and DevOps tools.
- Cloud services
- APIs
Support & Community
Vendor support.
#9 — SolarWinds Pingdom Synthetic
Short description: A synthetic monitoring solution focused on uptime and performance tracking.
Key Features
- Uptime monitoring
- Transaction monitoring
- Alerting
- Performance tracking
- Reporting
Pros
- Simple and reliable
- Easy setup
Cons
- Limited advanced capabilities
- Smaller ecosystem
Platforms / Deployment
Cloud
Security & Compliance
Not publicly stated
Integrations & Ecosystem
Works with monitoring and alerting systems.
- APIs
- Incident tools
Support & Community
Vendor support.
#10 — Grafana Synthetic Monitoring
Short description: A synthetic monitoring solution integrated into the Grafana observability stack.
Key Features
- Synthetic checks
- Integration with Grafana dashboards
- API monitoring
- Global probes
- Alerting
Pros
- Open-source-friendly
- Strong visualization
Cons
- Requires setup
- Limited advanced features
Platforms / Deployment
Cloud / Self-hosted
Security & Compliance
Not publicly stated
Integrations & Ecosystem
Integrates with Grafana ecosystem and observability tools.
- Prometheus
- Loki
- APIs
Support & Community
Strong community support.
Comparison Table (Top 10)
| Tool Name | Best For | Platform(s) Supported | Deployment | Standout Feature | Public Rating |
|---|---|---|---|---|---|
| Datadog | Full-stack | Web | Cloud | Unified observability | N/A |
| New Relic | Unified monitoring | Web | Cloud | Ease of use | N/A |
| Dynatrace | Enterprise | Web | Cloud | AI insights | N/A |
| Pingdom | Uptime | Web | Cloud | Simplicity | N/A |
| Uptrends | Global testing | Web | Cloud | Coverage | N/A |
| Catchpoint | Enterprise | Web | Cloud | Global nodes | N/A |
| Checkly | Developers | Web | Cloud | CI/CD integration | N/A |
| Site24x7 | SMB | Web | Cloud | Cost-effective | N/A |
| SolarWinds | Simplicity | Web | Cloud | Easy setup | N/A |
| Grafana | Open-source | Web | Hybrid | Visualization | N/A |
Synthetic Monitoring Tools Scoring
| Tool Name | Core (25%) | Ease (15%) | Integrations (15%) | Security (10%) | Performance (10%) | Support (10%) | Value (15%) | Weighted Total |
|---|---|---|---|---|---|---|---|---|
| Datadog | 9 | 8 | 10 | 9 | 9 | 9 | 7 | 8.9 |
| New Relic | 9 | 9 | 9 | 9 | 9 | 9 | 8 | 9.0 |
| Dynatrace | 10 | 7 | 9 | 10 | 10 | 9 | 7 | 9.1 |
| Pingdom | 7 | 9 | 7 | 7 | 8 | 8 | 9 | 8.0 |
| Uptrends | 8 | 8 | 8 | 7 | 8 | 8 | 8 | 8.0 |
| Catchpoint | 10 | 7 | 9 | 9 | 9 | 9 | 7 | 8.9 |
| Checkly | 8 | 9 | 8 | 7 | 8 | 8 | 8 | 8.1 |
| Site24x7 | 8 | 8 | 8 | 8 | 8 | 8 | 9 | 8.2 |
| SolarWinds | 7 | 9 | 7 | 7 | 8 | 8 | 8 | 7.9 |
| Grafana | 8 | 7 | 8 | 7 | 8 | 9 | 9 | 8.1 |
How to interpret scores:
- Scores are comparative across tools
- Enterprise tools lead in automation and analytics
- Open-source tools offer strong value
- Cloud tools provide ease and scalability
- Choose based on testing complexity and environment
Which Synthetic Monitoring Tools Is Right for You?
Solo / Freelancer
- Use Pingdom or Grafana Synthetic Monitoring
- Focus on simplicity and cost
SMB
- Site24x7 or Checkly
- Balance features and affordability
Mid-Market
- Datadog or New Relic
- Focus on integration and scalability
Enterprise
- Dynatrace or Catchpoint
- Focus on global monitoring and advanced analytics
Budget vs Premium
- Open-source tools offer cost savings
- Premium tools provide advanced features
Feature Depth vs Ease of Use
- Dynatrace = powerful
- Pingdom = simple
Integrations & Scalability
- Choose tools with CI/CD and cloud integrations
- Ensure global test coverage
Security & Compliance Needs
- Enterprises should prioritize audit logs and RBAC
- Smaller teams can focus on uptime monitoring
Frequently Asked Questions (FAQs)
What is synthetic monitoring?
It simulates user interactions to test performance and uptime.
How is it different from real user monitoring?
Synthetic uses simulated traffic; RUM uses real users.
Are synthetic tools expensive?
Varies; some are affordable while enterprise tools cost more.
Can I monitor APIs?
Yes, most tools support API monitoring.
Do these tools support automation?
Yes, many integrate with CI/CD pipelines.
How often can tests run?
From seconds to hours depending on configuration.
Are these tools cloud-based?
Most are cloud-native, some support hybrid deployment.
Do I need coding skills?
Some tools offer low-code options.
Can I monitor globally?
Yes, many tools offer global test locations.
Can I switch tools later?
Yes, but test scripts may need rewriting.
Conclusion
Synthetic Monitoring Tools play a critical role in ensuring application availability, performance, and reliability before users are affected. They provide proactive insights, enabling teams to detect and fix issues early.